Seasonal leaf color transition
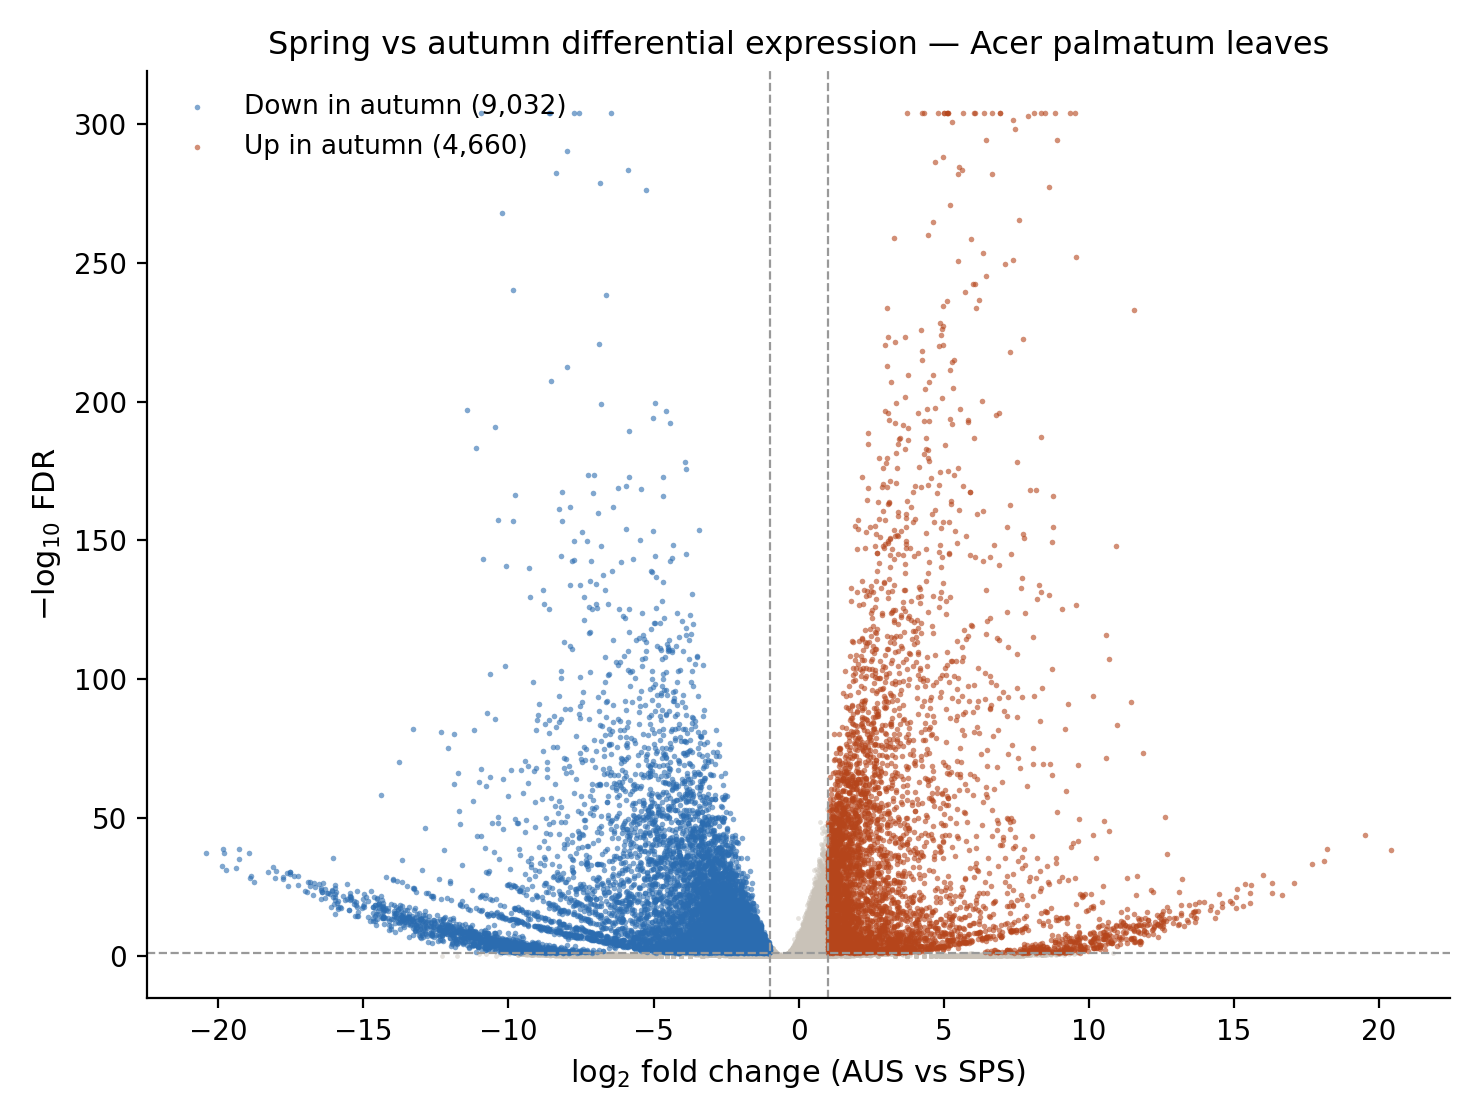
Acer palmatum shows a double red-leaf phenotype: young spring leaves flush red-purple, mature summer leaves are green, and senescing autumn leaves turn scarlet. Leaves were sampled in each season (3 biological replicates) for RNA-seq and targeted flavonoid metabolomics — sample groups SPS (spring), SUS (summer), AUS (autumn).
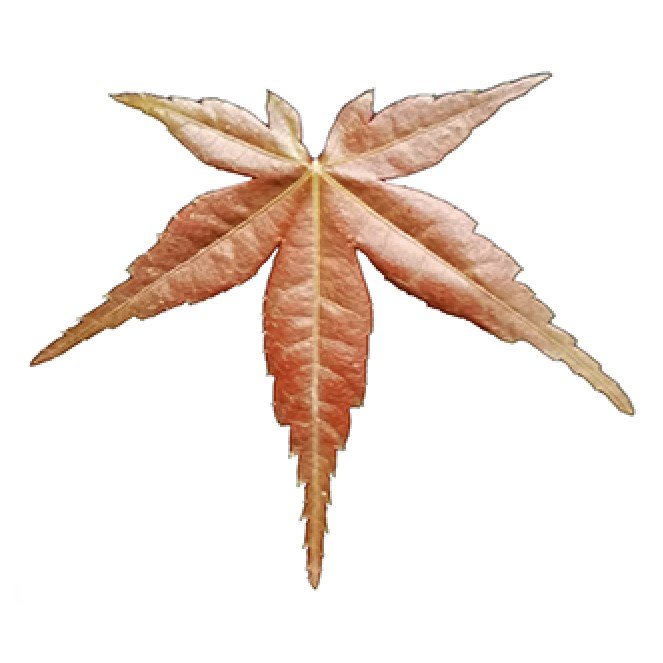 SPS · Spring
Spring flush — red-purple
Young expanding leaves. Spring-module genes peak (ApCHS5, ApF3′H1, ApANR, ApLAR2); delphinidin and (−)-epiafzelechin reach their seasonal maxima.
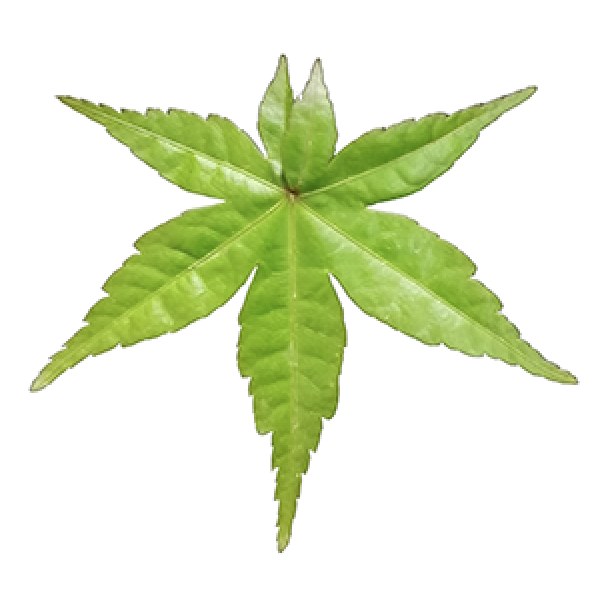 SUS · Summer
Summer canopy — green
Mature green leaves. All 20 flavonoid genes have their lowest seasonal expression in this dataset.
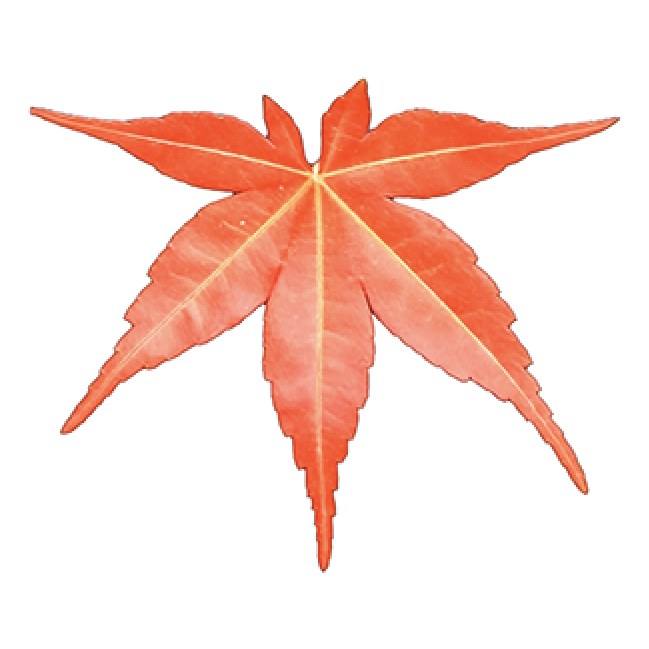 AUS · Autumn
Autumn senescence — scarlet
ApCHS3 expression is 6,435 FPKM and ApANS expression is ~640× its summer value; naringenin chalcone and (−)-epicatechin have their highest seasonal values.
From pathway to pigment
Red leaf color in maples is produced by anthocyanins — glycosylated anthocyanidins accumulating in vacuoles — while the same upstream pathway also feeds flavan-3-ols (catechins), the building blocks of proanthocyanidins. The pathway is conventionally split into early biosynthetic steps (CHS → CHI → F3H → F3′H), which build the dihydroflavonol skeletons, and late biosynthetic steps (DFR → ANS, then ANR/LAR/UFGT), which commit flux to anthocyanidins and their derivatives.
This dataset covers all eight enzyme families with annotated Acer palmatum genes (20 copies) plus nine pathway metabolites. The MYB–bHLH–WD40 regulators that switch the pathway on are not part of this gene set yet; upstream phenylpropanoid genes (PAL, C4H, 4CL) and the glycosyltransferase UFGT are likewise shown in the pathway for context only.
Seasonal expression and metabolite values
(6,435 vs 5.2 FPKM)
(1,219 vs 1.9 FPKM)
(248 vs ~4 FPKM elsewhere)
most abundant metabolite
The two red-leaf seasons show higher expression of different members of the same enzyme families. These seasonal expression patterns also appear in the correlation network; they do not establish causal control of leaf colour or transcript isoform switching:
Spring module
ApCHS5ApCHS8ApCHS9ApF3'H1ApANRApLAR2
Expressed almost exclusively in spring leaves. Correlates positively with delphinidin and (−)-epiafzelechin — the flavan-3-ol / proanthocyanidin branch runs alongside pigmentation in young leaves.
Autumn module
ApCHS3ApCHI2ApF3HApF3'H2ApDFRApANSApLAR1
These genes have higher expression in autumn, moderate expression in spring and low expression in summer. They span the annotated CHS→CHI→F3H→F3′H→DFR→ANS steps.
Data & related MapleOmics modules
Data description: leaf transcriptome (Illumina RNA-seq, FPKM) and targeted flavonoid metabolome (LC-MS/MS peak areas) of Acer palmatum leaves in spring (SPS), summer (SUS), and autumn (AUS), three biological replicates each. Gene identifiers follow the Acer palmatum genome assembly (A.palmatum_LGxx_Gxxxxx); enzymes are keyed to KEGG orthology, metabolites to KEGG compound IDs. Data from the Jiangsu Academy of Agricultural Sciences (JAAS).
Look up pathway genes in the Transcriptome module
Search any ApCHS/ApANS/… gene ID for full expression profiles, annotation, and sequences.
Explore chromatin & methylation at these loci
ATAC-seq and WGBS tracks for spring leaves are available in the Epigenome browser.